How I Added Langfuse to My AI Chatbot
A few weeks ago, a user told me “the bot logged the wrong calories,” and I had absolutely nothing to debug it with except one console.log line that only fires when the chatbot completely gives up:
console.log({ rounds: MAX_TOOL_ROUNDS }, "Exhausted tool rounds")That’s it. That was my entire visibility into what my chatbot’s tool-calling loop was doing. Which tool got called, what arguments the model passed to it, what came back, how long it took, whether something quietly failed - none of that existed anywhere. If something went weird mid-conversation, my only option was to stare at the final reply and guess.
So I added Langfuse, an open-source LLM observability tool, to trace every single round of my chatbot’s tool loop. This post is what I learned doing that, written for anyone who’s in the same spot I was: an agentic loop that mostly works, and zero idea what happens inside it when it doesn’t.
I also went down a small rabbit hole on one question before shipping this: does bolting a tracing SDK onto a live request path make the app slower or heavier? I’ll answer that too, because it mattered to me before I trusted this in production.
First, what is Langfuse actually recording?
Langfuse organizes everything around three nested ideas, and once these clicked for me, the rest of the integration made sense:
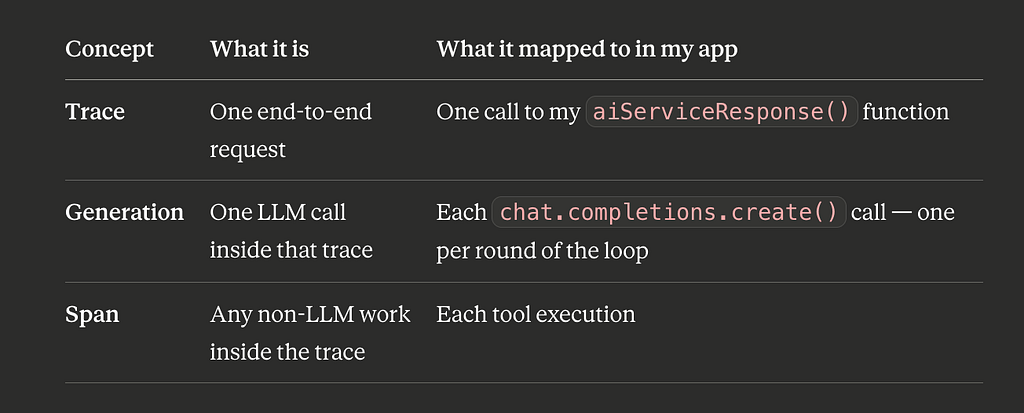
A trace is just a tree. For a chatbot reply that needed two rounds of tool calls before answering, it looks like this:
trace: chatbot-request (userId: abc123)
├─ generation: round-0   (model decides it needs tools)
│   ├─ span: tool:get_user_profile        → { height, weight, goal }
│   └─ span: tool:get_today_nutrition      → { calories_consumed, remaining }
├─ generation: round-1   (model decides it needs log_meal)
│   └─ span: tool:log_meal                 → { success: true, id: 412 }
└─ generation: round-2   (model returns final text, no more tool calls)
Open that trace in the Langfuse dashboard and you can see exactly what happened: every round, every tool’s exact input and output, every latency, and exactly where (if anywhere) something errored or returned something unexpected. This is the thing I was missing.
Does this make the app heavier?
This was my actual worry before adding it, so I checked it carefully rather than just trusting the marketing copy. Short answer: no, not in any way that matters for request latency, with one caveat for serverless setups.
A few things make this true:
The SDK never sits in front of your LLM call. You only call something like generation.end({...}) after the model has already responded, you're recording what already happened, not adding a round-trip before it happens.
Events get queued in memory and sent to Langfuse’s servers on a background timer, not synchronously on every call. According to Langfuse’s own docs, the SDKs are explicitly designed to queue and batch events in the background, specifically so your application’s response time isn’t affected, and the flush call itself is documented to retry quietly on network issues rather than throw an exception into your code. So your request handler isn’t sitting around waiting on a network call to Langfuse mid-loop.
The package itself is lightweight pure JavaScript with no native bindings, so it doesn’t meaningfully bloat install size or cold-start size.
The actual CPU/memory cost on your side is just JSON-serializing data you’re already holding in memory (messages, tool args, tool results) - trivial next to the network call to the LLM provider that you’re already making.
The one place this genuinely matters: serverless platforms like AWS Lambda. Lambda can freeze the execution environment the instant your handler returns a response, and any background timer doing the batching can get frozen mid-flight, silently dropping traces you thought you captured. This is a real, documented gotcha - Langfuse’s own docs specifically call out that short-lived environments like serverless functions need an explicit flush before the process exits or gets frozen, or you risk losing events. The fix is a single explicit flush call right before your handler returns. That does add a small, bounded bit of latency to the end of the request - basically one HTTP POST, usually tens of milliseconds - but it doesn’t touch the LLM call or tool calls themselves, and you won’t even notice it if you’re running locally outside of Lambda.
So the honest tradeoff isn’t speed. It’s that you now have one more external dependency in your code path, which is why I made sure a Langfuse outage could never become a chatbot outage (more on that below).
Cloud vs. self-hosting
You’ve got two options, and the SDK code doesn’t change between them — you just point a baseUrl at a different place.
Langfuse Cloud is the fastest way to start. It has a free tier that’s generous enough for a small app’s traffic, and there’s no infrastructure to run yourself.
Self-hosting is open-source and Docker-deployable, but it’s really only worth the extra ops work if you have a compliance reason to keep all your trace data inside your own infrastructure.
I started with Cloud, and I’d recommend anyone else do the same, nothing about the instrumentation changes later if you decide to self-host.
Setting it up
Install the package:
npm install langfuse
Add three environment variables - these are backend-only secrets, same rule as every other API key in my project, never sent to the frontend:
LANGFUSE_PUBLIC_KEY=pk-lf-...
LANGFUSE_SECRET_KEY=sk-lf-...
LANGFUSE_BASE_URL=https://cloud.langfuse.com
(You get these from the Langfuse dashboard after creating a project.)
Then create a single shared client, instantiated once and reused everywhere:
// services/observability/langfuse.js
import { Langfuse } from "langfuse";
const langfuse = new Langfuse({
  publicKey: process.env.LANGFUSE_PUBLIC_KEY,
  secretKey: process.env.LANGFUSE_SECRET_KEY,
  baseUrl: process.env.LANGFUSE_BASE_URL,
});
export default langfuse;
If those env vars are missing, the SDK won’t throw an error straight into your request - it just fails quietly when it eventually tries to flush. I still treat observability as strictly additive: the chatbot has to keep working whether or not Langfuse is configured at all.
Wiring it into the actual loop
This is the part that solves the original problem. I wrapped the round-by-round loop in my provider file, without changing any of its actual control flow:
const generateOpenAIResponse = async (inputMessages, toolContext = {}) => {
  const messages = [...inputMessages];
const trace = langfuse.trace({
    name: "chatbot-request",
    userId: toolContext.userId,
    input: inputMessages,
  });
for (let round = 0; round < MAX_TOOL_ROUNDS; round += 1) {
    const generation = trace.generation({
      name: `round-${round}`,
      model: "gpt-4o-mini",
      input: messages,
    });
const response = await client.chat.completions.create({
      model: "gpt-4o-mini",
      messages,
      tools,
      tool_choice: "auto",
    });
const message = response.choices[0].message;
    const toolCalls = message.tool_calls || [];
     generation.end({ output: message });
    if (toolCalls.length === 0) {
      trace.update({ output: message.content || "" });
      await safeFlush();
      return { content: message.content || "" };
    }
    messages.push({ role: "assistant", content: message.content || null, tool_calls: message.tool_calls });
    const toolResponses = await Promise.all(
      toolCalls.map(async (toolCall) => {
        const span = trace.span({
          name: `tool:${toolCall.function.name}`,
          input: toolCall.function.arguments,
        });
        try {
          const result = await runTool(toolCall, toolContext);
          span.end({ output: result });
          return { role: "tool", tool_call_id: toolCall.id, content: JSON.stringify(result) };
        } catch (error) {
          span.end({ level: "ERROR", statusMessage: error.message });
          return { role: "tool", tool_call_id: toolCall.id, content: JSON.stringify({ error: error.message }) };
        }
      })
    );
    messages.push(...toolResponses);
  }
  trace.update({ output: "exhausted-rounds" });
  await safeFlush();
  return { content: "I couldn't finish that — could you ask a narrower question?" };
};
A few choices here that I think matter, in case you’re doing the same thing:
One trace per request, tagged with the user ID. Every trace ends up filterable by user in the dashboard, so “show me everything that happened in this specific user’s last chatbot request” becomes a direct query instead of a CloudWatch log grep across timestamps.
One generation per loop iteration. This maps one-to-one onto the for loop that already existed - I didn't add any new control flow, just wrapped what was already there.
One span per tool call, created inside the existing Promise.all. Tool calls in my app run concurrently within a round, and that's fine - Langfuse correctly attributes spans created concurrently like that back to the same parent generation, it doesn't require them to run sequentially to trace them right.
Errors get recorded with level: "ERROR", not thrown differently. My tool layer already swallows errors into { success: false, error } payloads that get sent back to the model - adding tracing doesn't change that contract, it just makes those previously-silent failures visible in a dashboard instead of vanishing.
Keeping a Langfuse outage from becoming a chatbot outage
The goal of this integration is to add visibility, not to introduce a new way for the app to break. So I wrapped every flush call:
const safeFlush = async () => {
  try {
    await langfuse.flushAsync();
  } catch (e) {
    console.log(e, "Langfuse flush failed");
  }
};
Worth knowing: creating a trace, a generation, or a span, and calling .end() on them are all synchronous, in-memory operations - they just queue an event locally and don't touch the network. The only call that actually talks to Langfuse's servers, and therefore the only one that can fail because of a network problem, is the flush itself. So that's the only thing I bothered wrapping defensively.
What I actually get out of this now
When someone reports something weird, I open the matching trace in the Langfuse dashboard, and I can see, in order:
- The exact messages sent to the model at every round, including the system prompt and any context I’d injected
- The exact tool call the model decided to make and the exact arguments it generated - so I can tell, for example, whether it called log_meal with the wrong number because it misread good data, or because the tool itself returned bad data
- The exact return value of every tool